

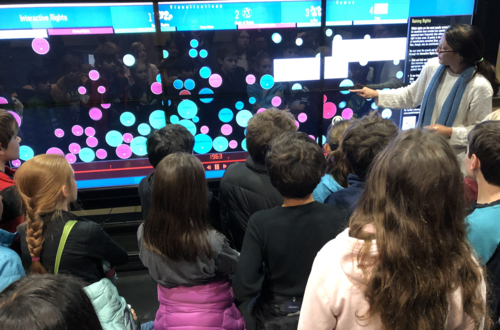
Studying graphs and thinking about data visualization has been a thread across the year, most especially during Campfire conversations and in Science Block. We’ve regularly analyzed and discussed some of the amazingly beautiful and fascinating graphs highlighted in The New York Times’ “What’s Going On With This Graph?” program, and our young scientists have had many thoughtful lessons and discussions related to how scientists use graphs to analyze and communicate data (great example can be found here). Yesterday, Auburn and Navy Banders walked over to The University of Texas’ VisLab to learn more about data visualization.…
Read More